
Back again after a long hiatus
It’s been almost an entire year since I’ve updated my blog– and my has it been an eventful year. Ever since I last posted here, I completed a 3 month industry internship with one of the largest data science teams in industry Stitch Fix, and accepted a fellowship at the NYU Center for Data Science and NYU Center for Cosmology and Particle Physics.
During this time, I moved from Nashville, spent three great months living in San Francisco and then moved to New York City (Greenwich Village). I’ve also gotten into online data science competitions, started data science consultancy, and think my colleague and I may have figured out what some of the dark matter circulating in our Universe could be. Things have happened fast; it’s been a whirlwind.
I’ve learned a great deal more about data science, in industry and academia alike, having grown quite a lot as a data scientist. Amongst learning a great deal from my mentors Dave Spiegel and Greg Novak at Stitch Fix last summer, I’ve also found that being involved in online data science competitions really takes you to another level as a data scientist. For these competitions I have spent most of my time involved in numer.ai, but now that I’m content with my progress on that problem, I am shifting my focus to drivendata.org. I am particularly attracted to this website since their overall goal is to address the world’s largest and most pressing issues by leveraging the power of data science.
Here is a figure I recently put together for the analysis of one of the competitions I am currently involved in:
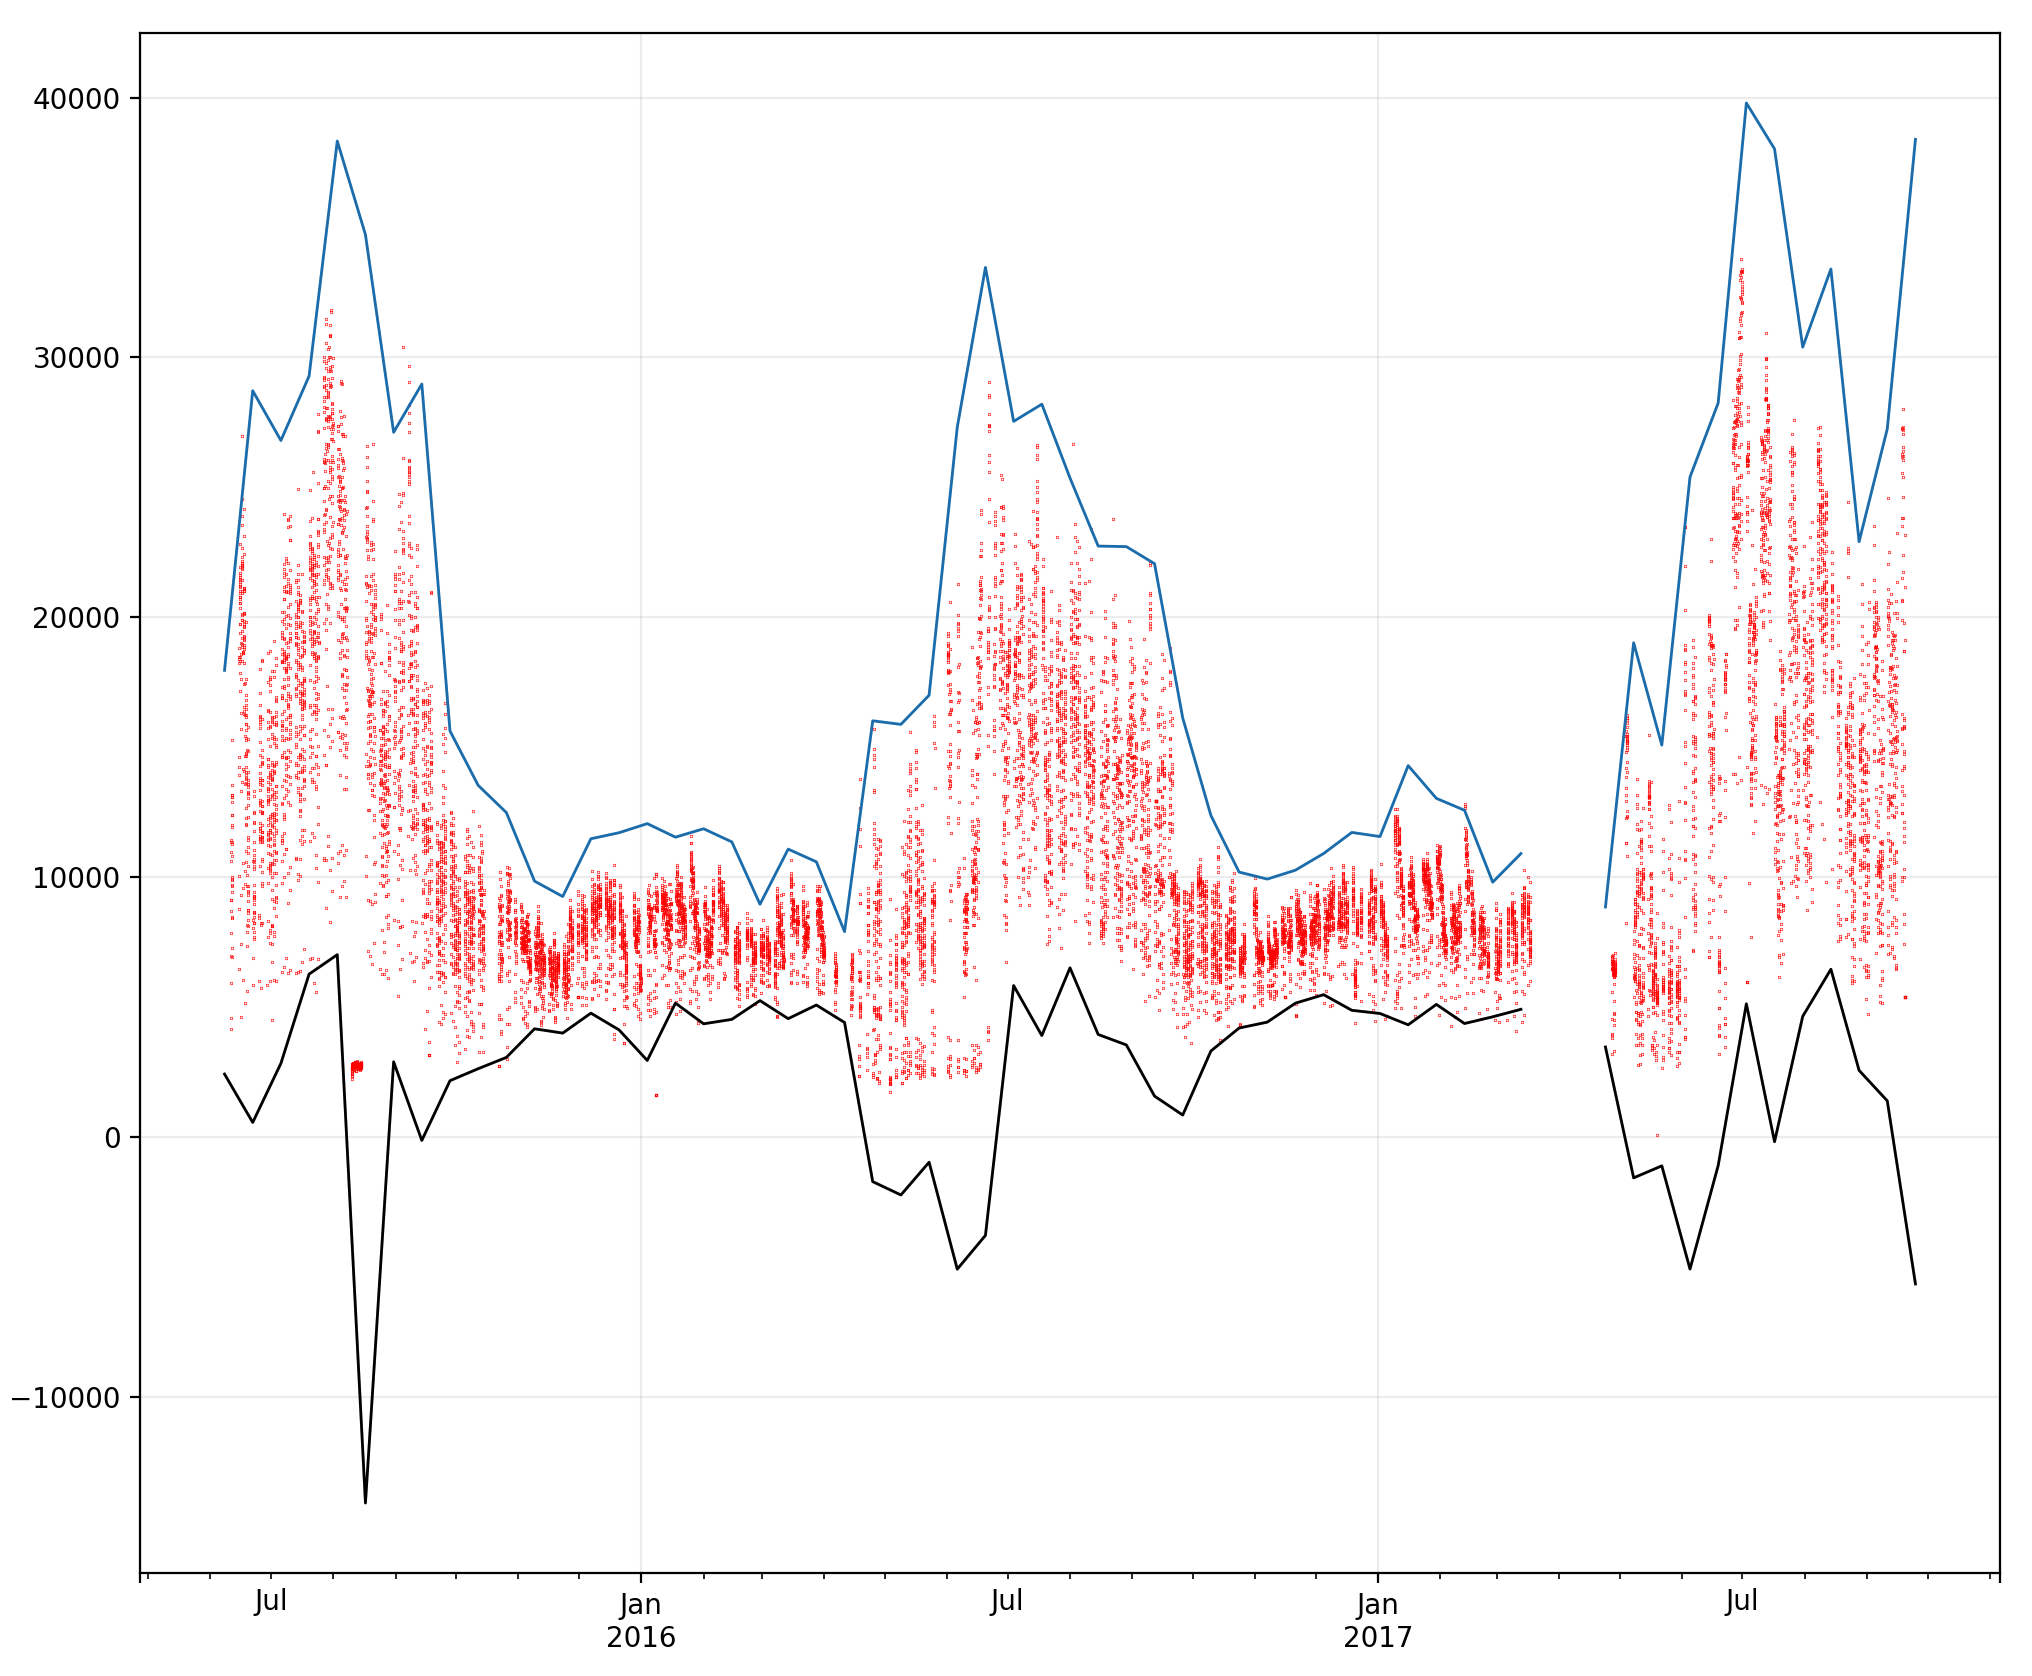
The competition is quite interesting in the sense that you are given quite a lot of usage data and asked to not only feature engineer, but also label the data you anticipate you will train your classifier with. The main concern of the company sponsoring this competition is to have a robust algorithm that can detect anomalies in power consumption in buildings. The figure above shows meter readings reported as a time series, with the outer bands depicting the 3 sigma Bollinger bands in the 2 week averaged data.
Because I am involved in these competitions, I’ll probably wait until they are completed to share some of my secrets :).